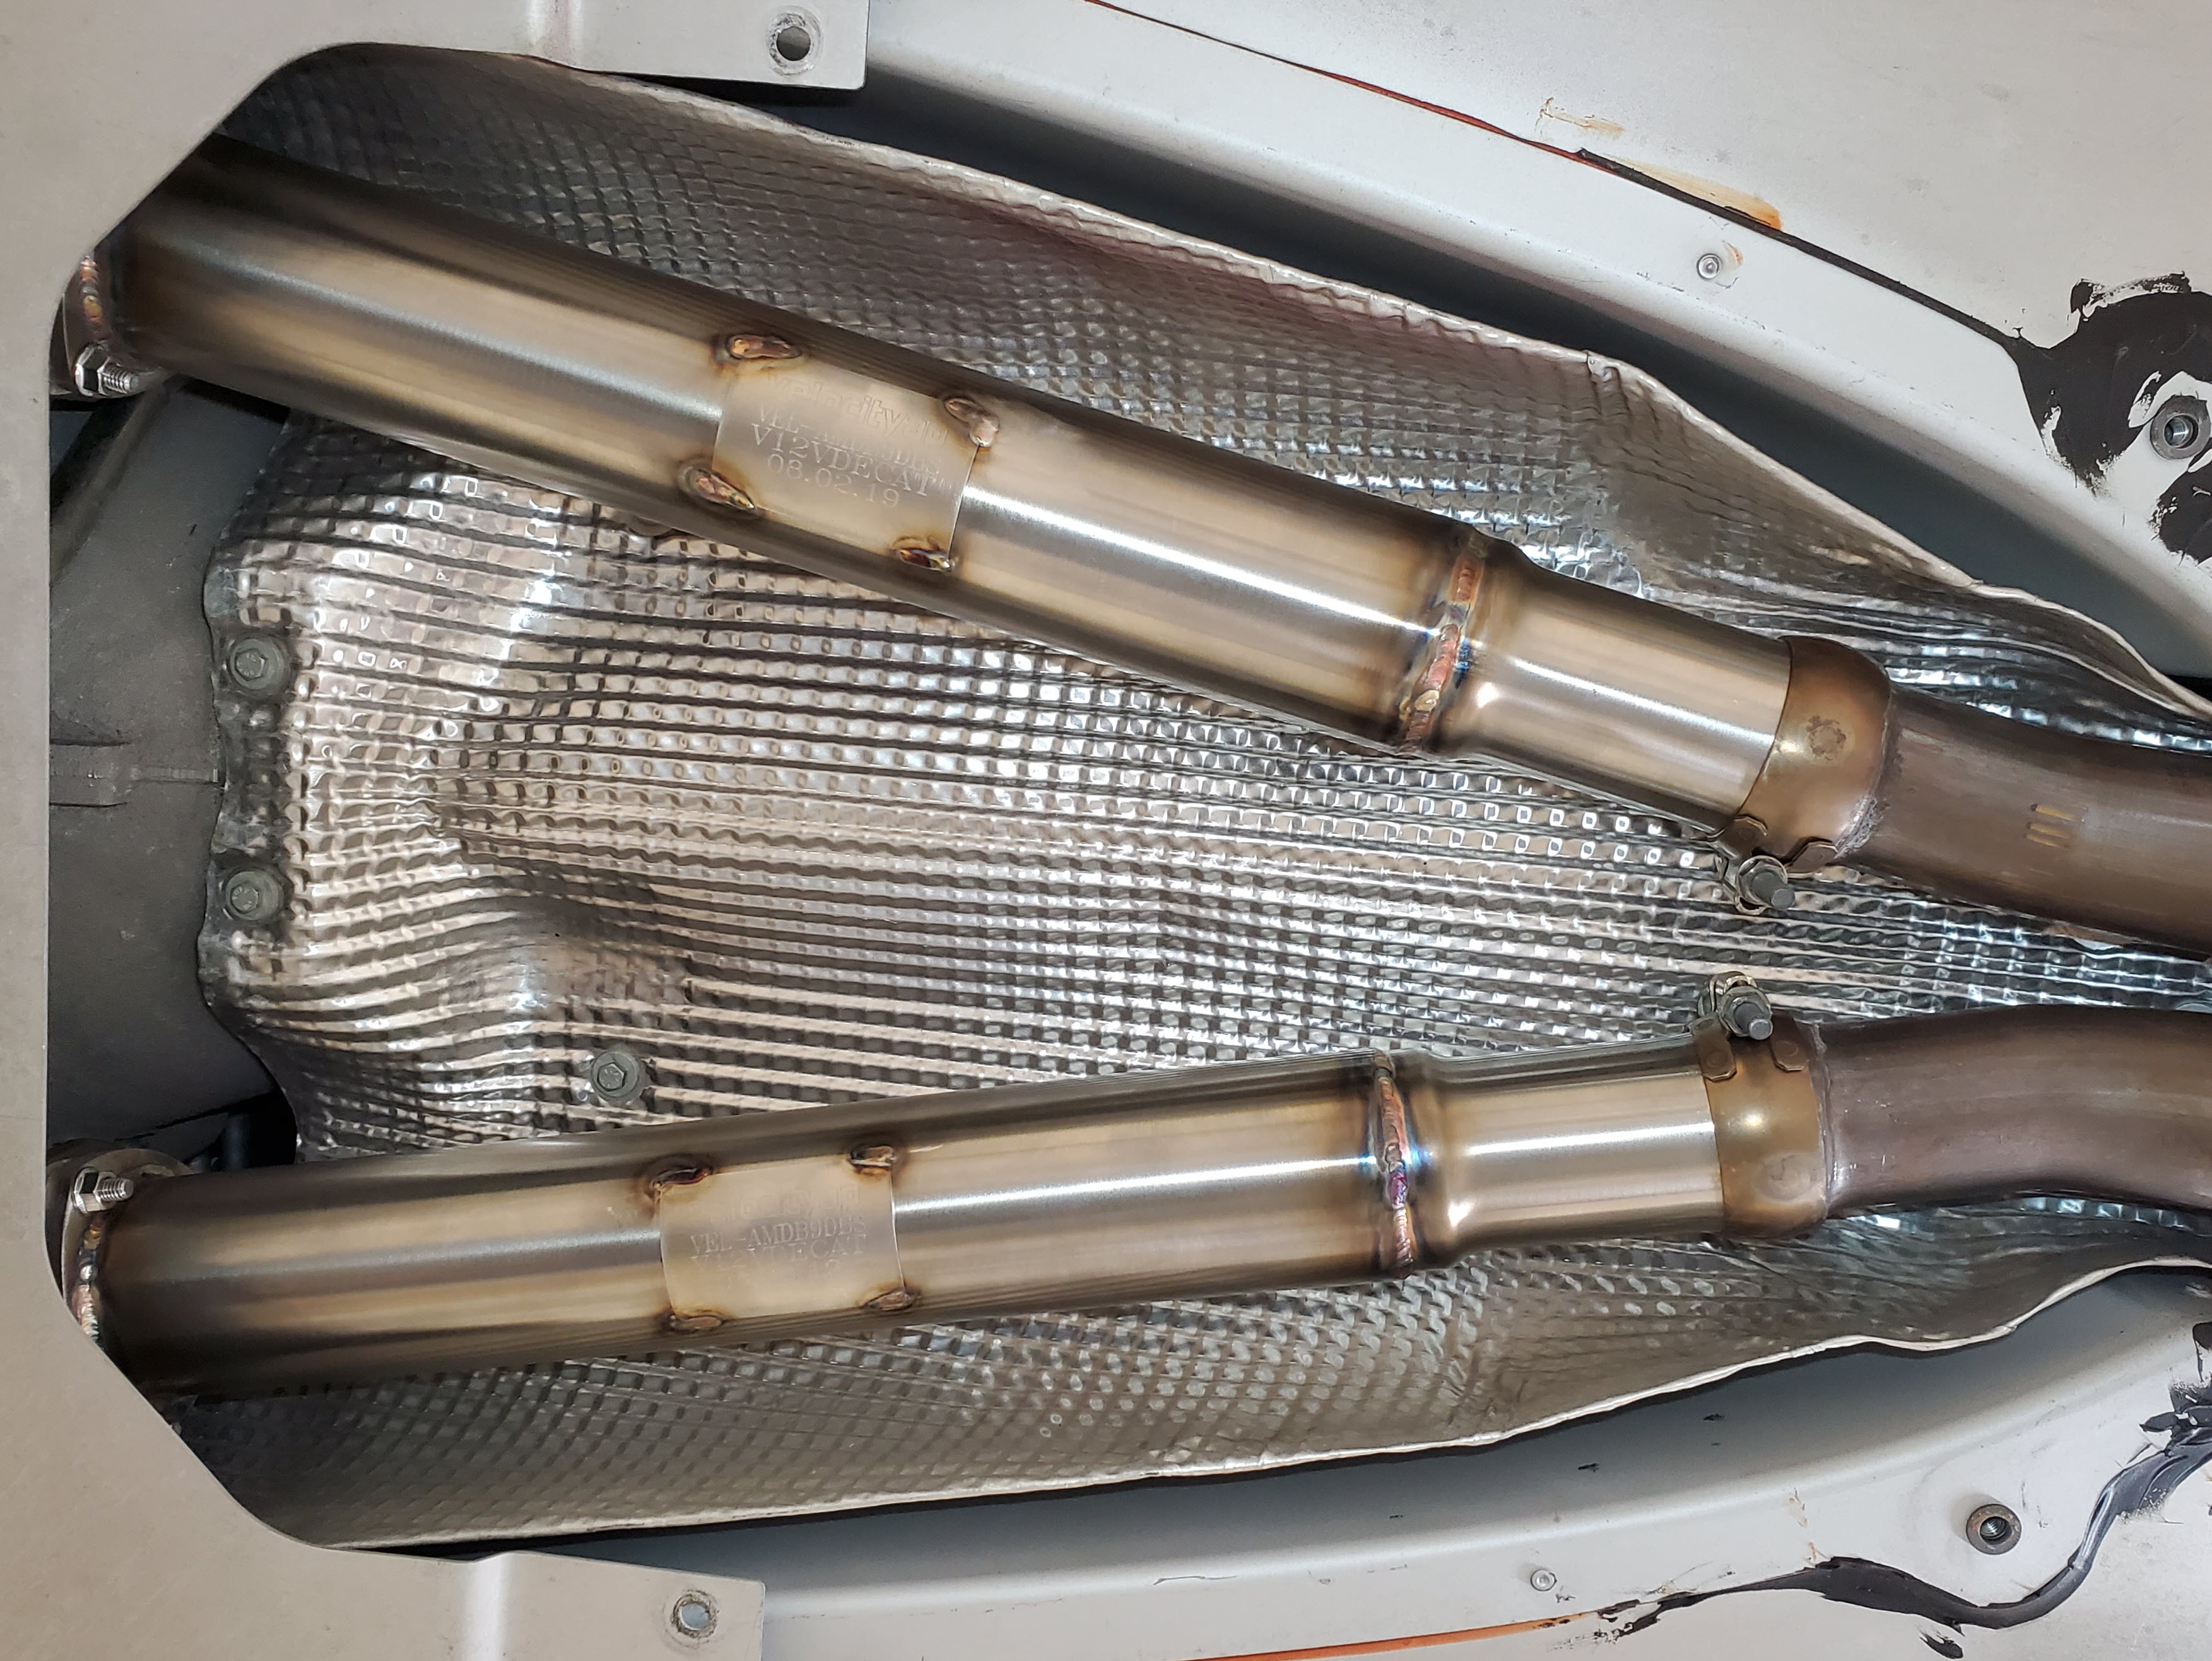
Power is like chocolate. You could always use more even though you don’t need it. I’ve been evaluating several ‘bolt on’ performance changes for my DB9, ultimately hoping to achieve power levels similar to a DBS (they are essentially just the same engine). In this article I am testing the changes that come with fitting a Secondary CAT Delete Kit (SCDK or decat). This is a popular modification that promises less weight, better sound and more performance. Its that last claim we are testing here.
I’m not a fan of seat of the pants claims like: “Ya, I bolted that on and it sure feels faster, but I haven’t had it tested.” Placebo effect. Make a change that you think will make the car faster, brain wants to believe its faster. I’m also a skeptic of manufacturers claims that aren’t backed up by published scientific test data. Boggles my mind why they don’t do that. Do they not actually test their upgrades before selling them? If they do, why don’t they take a few minutes to publish the results? Make believers of us. Well, you know me, I gotta know for certain, and now you will know.
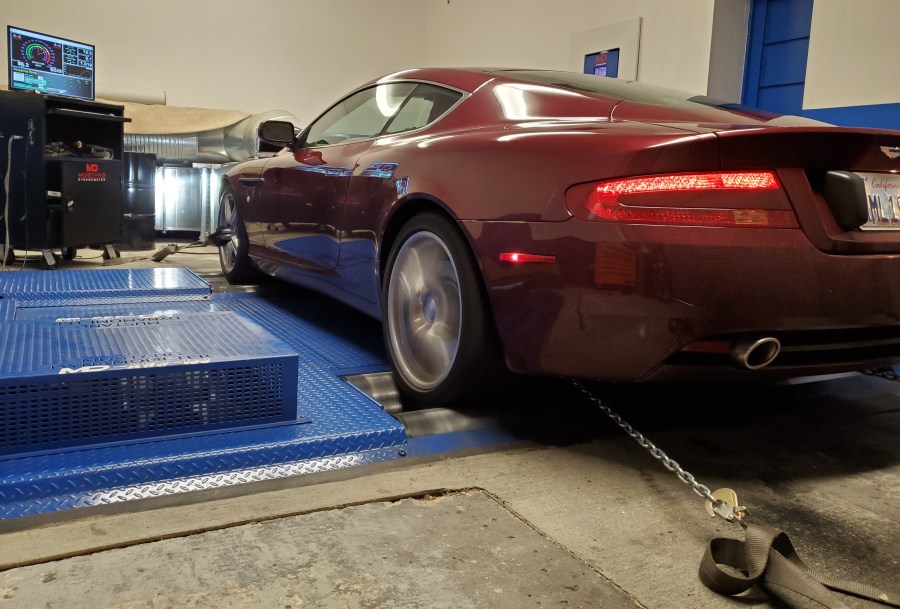
This is the third trip to the Dynamometer for my DB9 to test the changes (and each visit is a fun visceral event). In my first two trips we recorded data for:
- Baseline Performance – what was the existing power of my original car? My car is about 15 years old and has about 42,000 miles on it, and is in top shape, well-tuned and maintained. Check out this article and video on how I found out.
- Airbox Delete Kit Installed. I installed a Velocity AP GT4 Airbox Delete Kit with the hope of improving performance by allowing the engine to inhale more easily. The kit removes the stock airbox and replaces it with a performance air filter assembly. T0 learn more about the kit and installing it check out the article and video on this here. I had the second Dyno test done after the kit was installed, and you can view that test here.
 For comparison Dyno testing to be meaningful, you need to try and keep everything possible the same. Fuel, test rig, technician, etc. I’ve done just that. I’ve been taking my car to Travis of Snail Performance. We are using the Mustang 150 Dynamometer at M45 Automotive in Auburn, California. During each visit Travis runs the car through three (3) power pulls, going from idle to max RPMs when the power starts to fall off. We have the car in Sport Mode, A/C system completely off, and the pull is done in third gear only.
Why third? Glad you asked. We want to be in a gear where the Dyno and gearing work the engine hard to its maximum effort. But, we don’t want the pull to take an overly long time running engine temperatures through the roof (like 6th gear). During the baseline test we found that in 4th gear the ultimate power measure was slightly higher, but the pulls took longer and heat build up (soak) was beginning to influence the results. We tried again in 3rd gear and the car was happier. It might leave a few bhp unaccounted for, but my key aim was comparisons of the changes, not maximizing some number.
Why aren’t the numbers anywhere near what Aston claims is the engine power and torque in the manuals? Another good question. 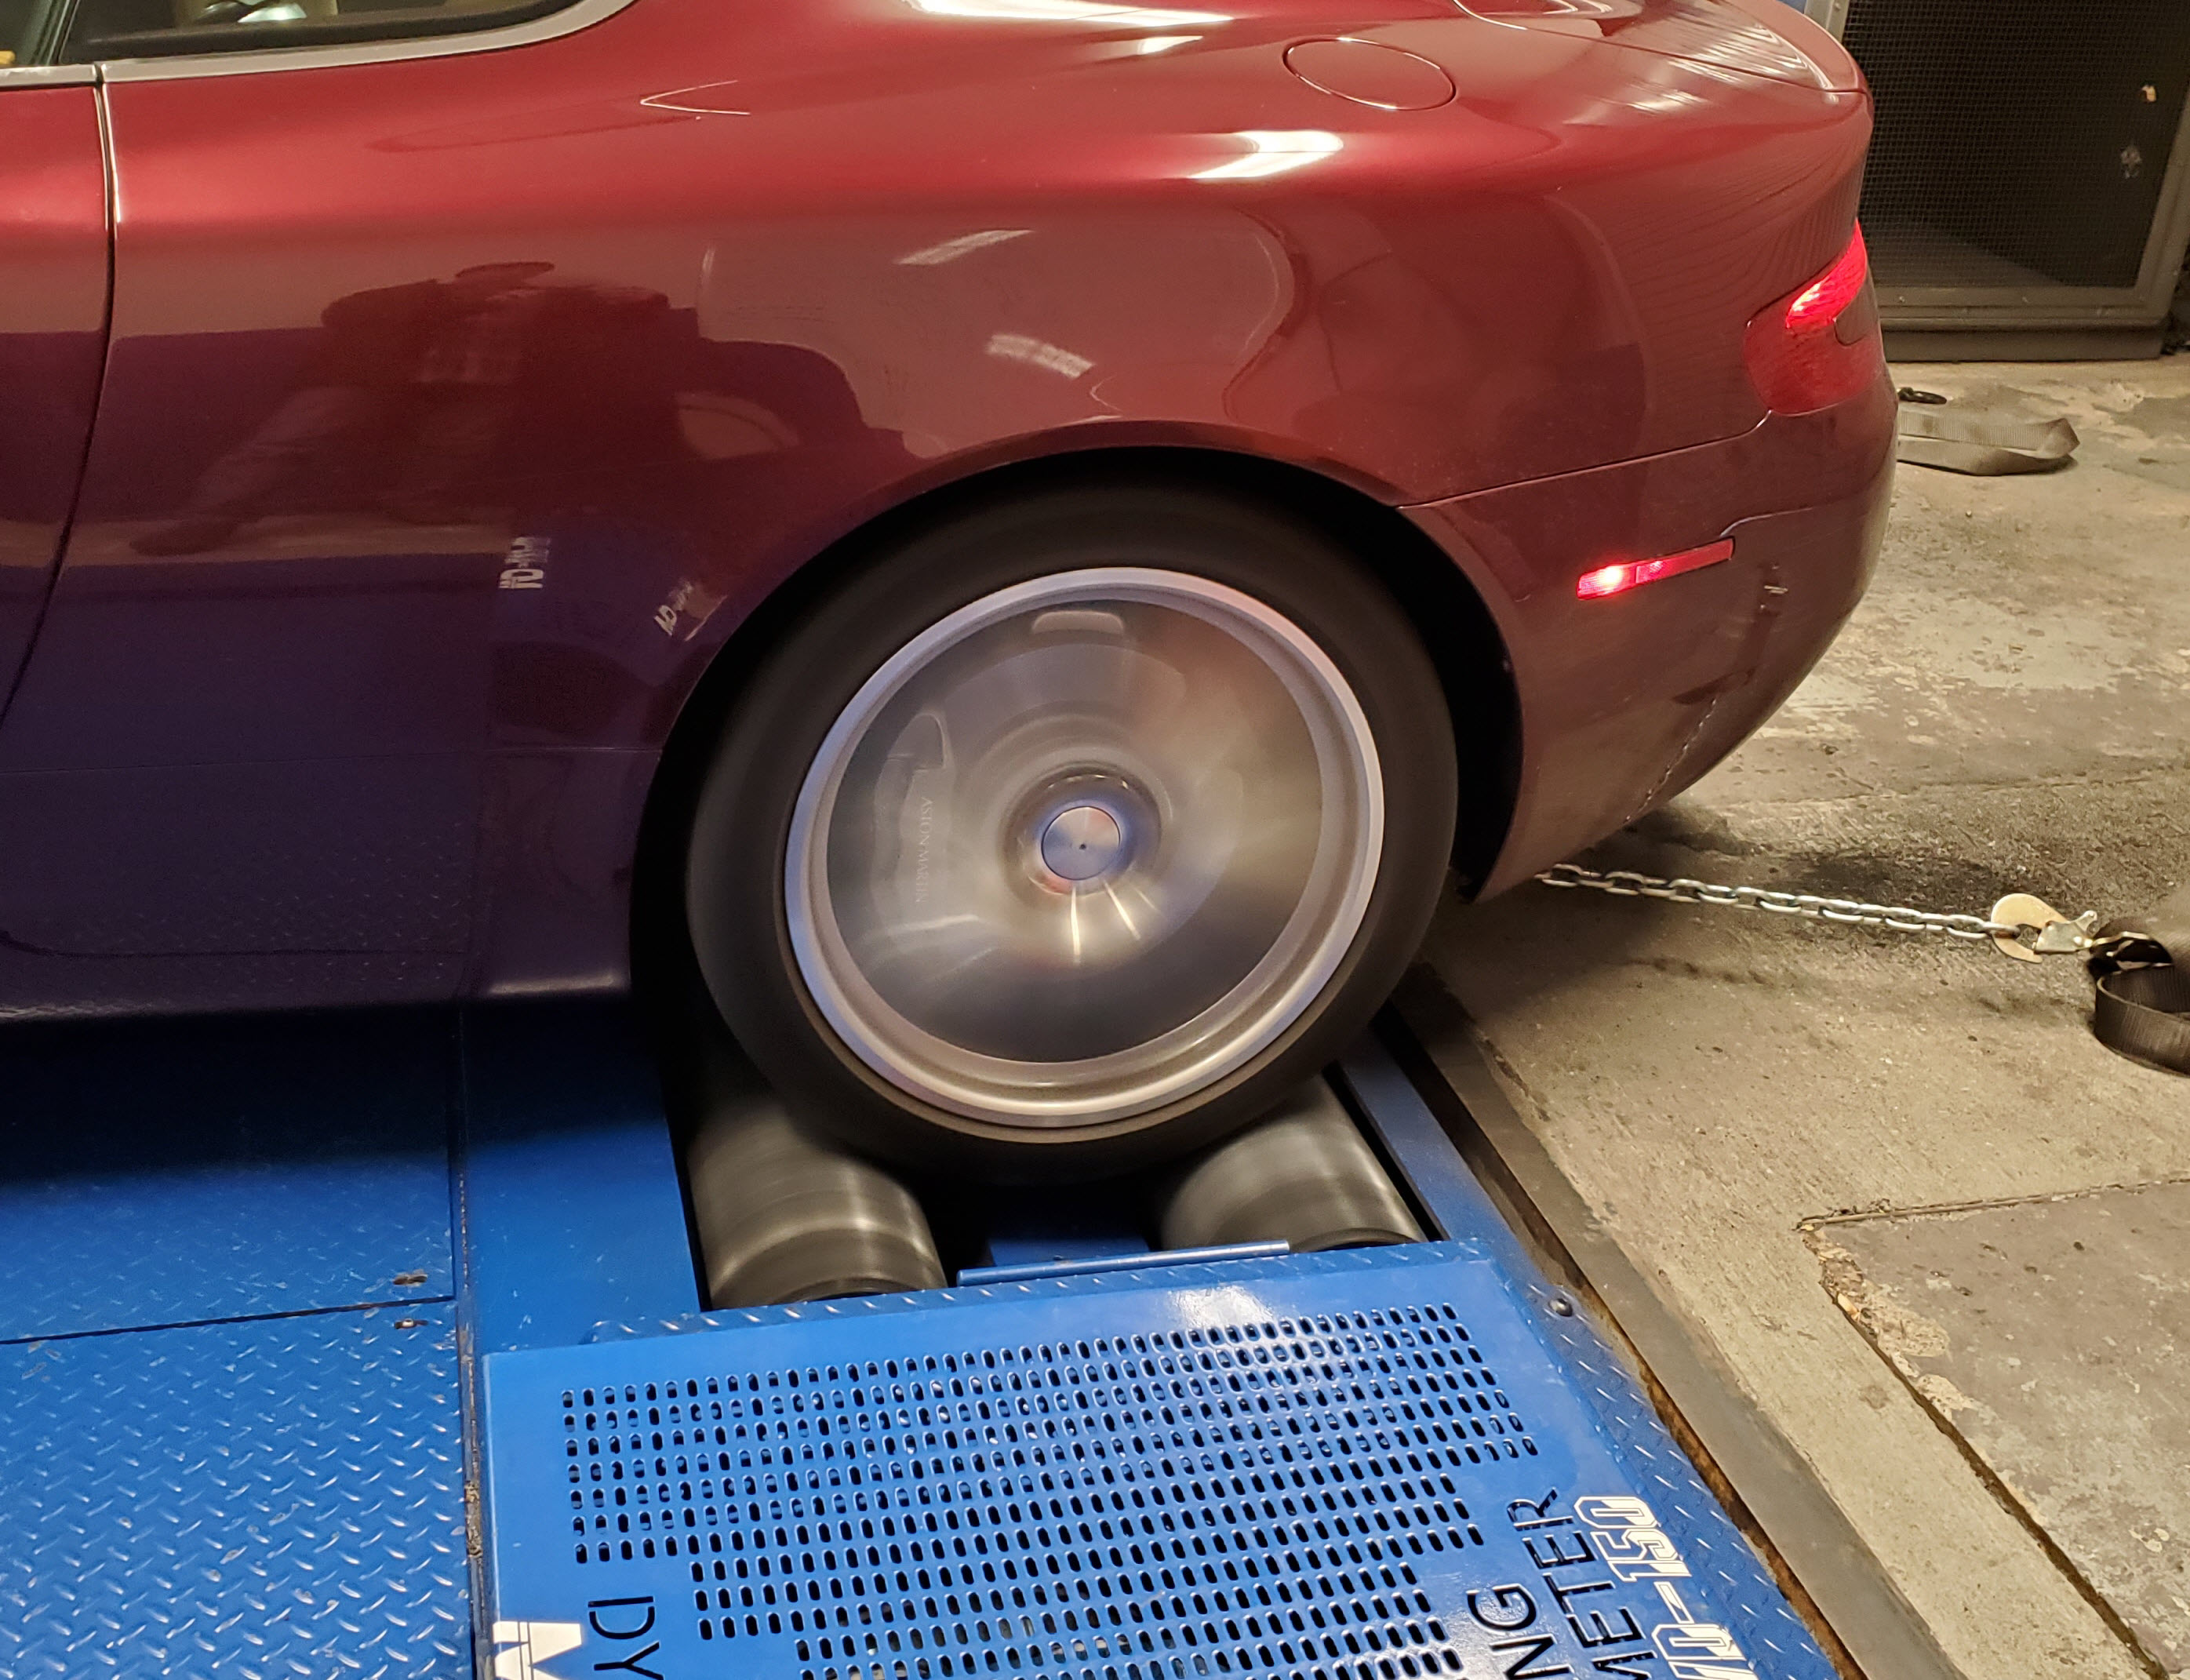 We are measuring ‘at the rear wheels’, meaning where the rubber meets the road (literally). The rear wheels are on rollers, and the rollers are the measuring tool of the Dyno. Manufacturers published engine power is always of just the engine sitting on a testing stand coupled directly to the Dynamometer. The difference is all the loss attributed to the drivetrain between the engine and road wheel. The transmission, the differential, the drive shafts, axle shafts, wheel bearings, brake rotors, etc. all create losses in the system (all the time) and reduce the amounts of power and torque that actually make it to the rear wheels. There is no way to precisely know how the rear wheel measured numbers relate to the engine power without actually removing the engine and testing it separately. As a rule of thumb, most people generically quote about 15% power loss through the drivetrain. If the stock DB9 engine is listed as 450 bhp by the manufacturer, you can roughly expect about 85% or 382 bhp to make it to the road. From my results showing 367 peak bhp in the baseline run, that would be about 18% power loss through the drivetrain if you believe the engine makes 450 bhp as Aston claimed. Again, my testing is comparative, so this isn’t that important.

Results
 Travis ran the car through three pulls and gathered data. Each run isn’t identical, but very close. Here are the results of the best run listed against the previous two Dyno tests.
Peak Values
These are the numbers that get all the press, but are really only achieved at a very high RPM where we rarely, if ever drive the engine:
- Power – 382 bhp at 5600 rpm
- Torque – 373 ft-lbs at 4750 rpm
Average Value
- Avg. Power – 282 bhp
- Avg. Torque – 334 ft-lbs
What is average power? As Travis explained to me, it’s a better representation of the overall engines performance. What use is a performance improvement that’s only change is adding 10 bhp between 6,000 and 6,500 rpm? It might be something if you drive at redline all the time (tracking the car), but useless for any other purpose. Average power is the average across the entire RPM range. Area under the curve. Accounts for all the gains mid-range, top end, etc. Raising the average power is a measure of increasing the overall performance of the engine.
How does it compare?
How does the cars performance with the SCDK installed versus the baseline and the test with only the Airbox Delete kit installed? Here is the overlay Graph.
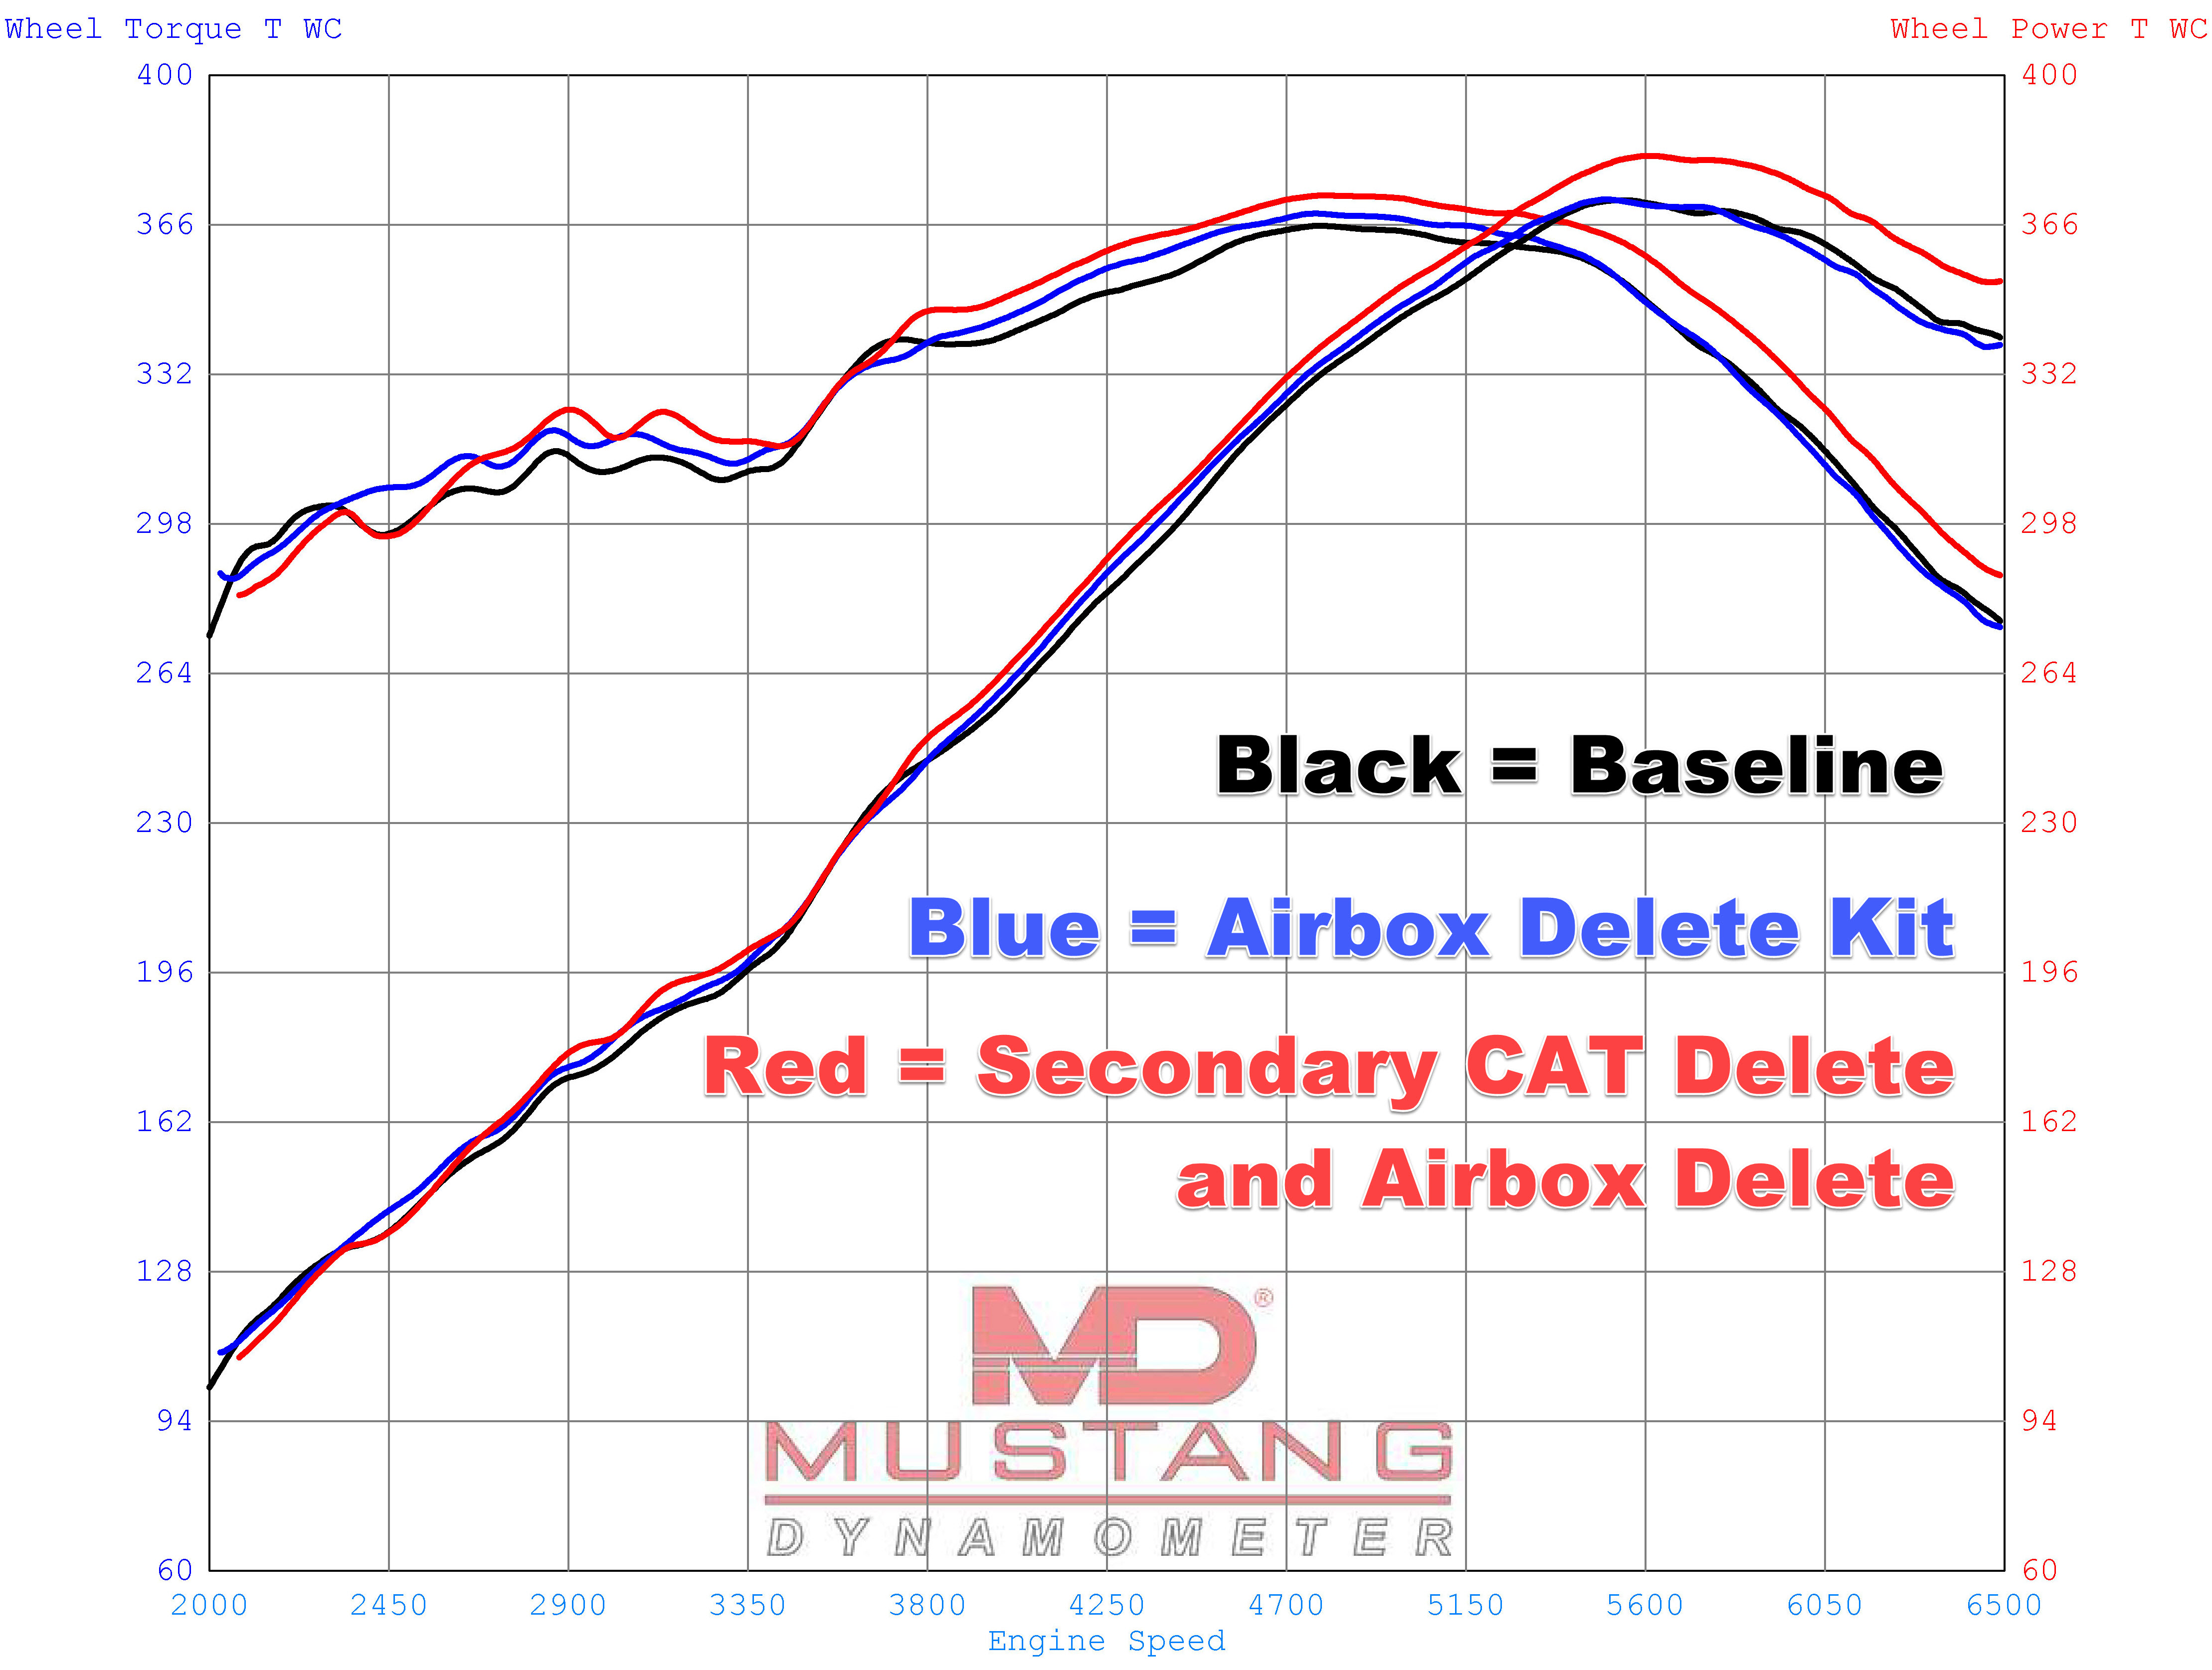
- Black = Baseline Performance
- Blue = Airbox Delete Kit Installed
- Red = Secondary CAT Delete Kit & Airbox Delete Kit Installed
This was a nice improvement. It increased peak horsepower by 10 bhp over baseline. It made some minor improvements to power and torque mid-rpm, but wasn’t a huge improvement in the normal driving Rev range (1500 to 2500 rpm). My guess is that during lower RPMs our cars exhaust system hasn’t been choked off, but at the maximum RPM the restriction caused by the Secondary CAT was holding back performance. Removing this restriction has allowed the engine to breath easier at max RPM, so it can make more power.
| Baseline | Airbox Delete Kit Only | Airbox and Secondary CAT Delete Kits | ||
| Torque (ft-lbs) | Peak | 366 @ 4750 RPM | 369 @ 4750 RPM | 373 @ 4750 RPM |
| Average | 326 | 328 | 334 | |
| Midrange | 311 @ 3145 RPM | 317 @ 3145 RPM | 325 @ 3145 RPM | |
| Power (bhp) | Peak | 372 @ 5400 RPM | 372 @ 5400 RPM | 382 @ 5600 RPM |
| Average | 273 | 275 | 282 | |
| Midrange | 186 @ 3145 RPM | 189 @ 3145 RPM | 194 @ 3145 RPM |
Notable values:
- Peak performance increase
- Torque
- Up 7 ft-lbs over baseline (1.9%)
- Up 4 ft-lbs over airbox delete kit only (1.1%)
- Power
- Up 10 bhp over baseline (2.7%)
- Up 10 bhp over airbox delete kit only (2.7%)
- Torque
- Average performance increase
- Torque
- Up 8 ft-lbs over baseline (2.5%)
- Up 6 ft-lbs over airbox delete kit only (1.8%)
- Power
- Up 9 bhp over baseline (3.3%)
- Up 7 ft-lbs over airbox delete kit only (2.5%)
- Torque
- Midrange increase at about 3145 rpm
- Torque
- Up 14 ft-lbs over baseline (4.5%)
- Up 8 ft-lbs over airbox delete kit only (2.5%)
- Power
- Up 8 bhp over baseline (4.3%)
- Up 5 bhp over airbox delete kit only (2.6%)
- Torque
That mid-range increase is important. People may scoff at the effort to get “just 8 more bhp” but you need to understand the data. Your engine doesn’t make 450 bhp through the whole rev range, far from it. At 3145 rpm stock the engine made 186 bhp. Adding the 8 bhp there through these changes is a much more significant 4.3% increase in power (and a similar percentage of Torque), something you might actually feel in the seat of your pants.
Updated Feb 2021 – I’ve had an in depth discussion with Mike from Bamford Rose about Dyno testing DB9’s, the results, transmission power loss, and more. Mike was the performance engineer that dyno tested and developed the engine while he worked at Aston Martin. It covers a lot of territory on this topic and I’d recommend taking the time to watch from start to finish. Lots of interesting tidbits in it.
What’s next?
The final step in my quest for 50 more BHP is the biggest one. I am going to install a Velocity AP ECU Tune. That translates to reprogramming the engine control computer to make more power by adjusting its settings. Manufacturers tend to be conservative with the control parameters like spark timing and fuel ratios, its generally a compromise. Velocity AP has a kit that will read your existing paramenter, upload them to Velocity, they tweak them, and you download the revised values back into the cars existing ECUs. Completely reversible. The claim is something like a 30 bhp boost, and this might get me close to the magic 50 bhp I am seeking.
I am doing this step last for a reason. For the reprogramming to have best effect, it helps to have the car inhaling and exhaling better. The two modifications I’ve done so far have accomplished just that.
Stay tuned and watch for the future articles on installing the ECU tune and the Final Dyno test of the complete package.
Video
Of course, watching a Dyno test is a lot of fun. Being in the room is even more visceral. Something I would recommend if you have a Dyno shop near you. Here is a short video of the test, and Travis discussing the results.

I have been anxiously waiting these results, very informative and nice to know that the numbers are right at what velocity ap quotes. Can’t wait for next installment. Thanks for doing this Steve.
LikeLike
i can’t find the smog results after the cat delete. Can you aim me towards it please?
LikeLike